First look at some logger data
analysis
field
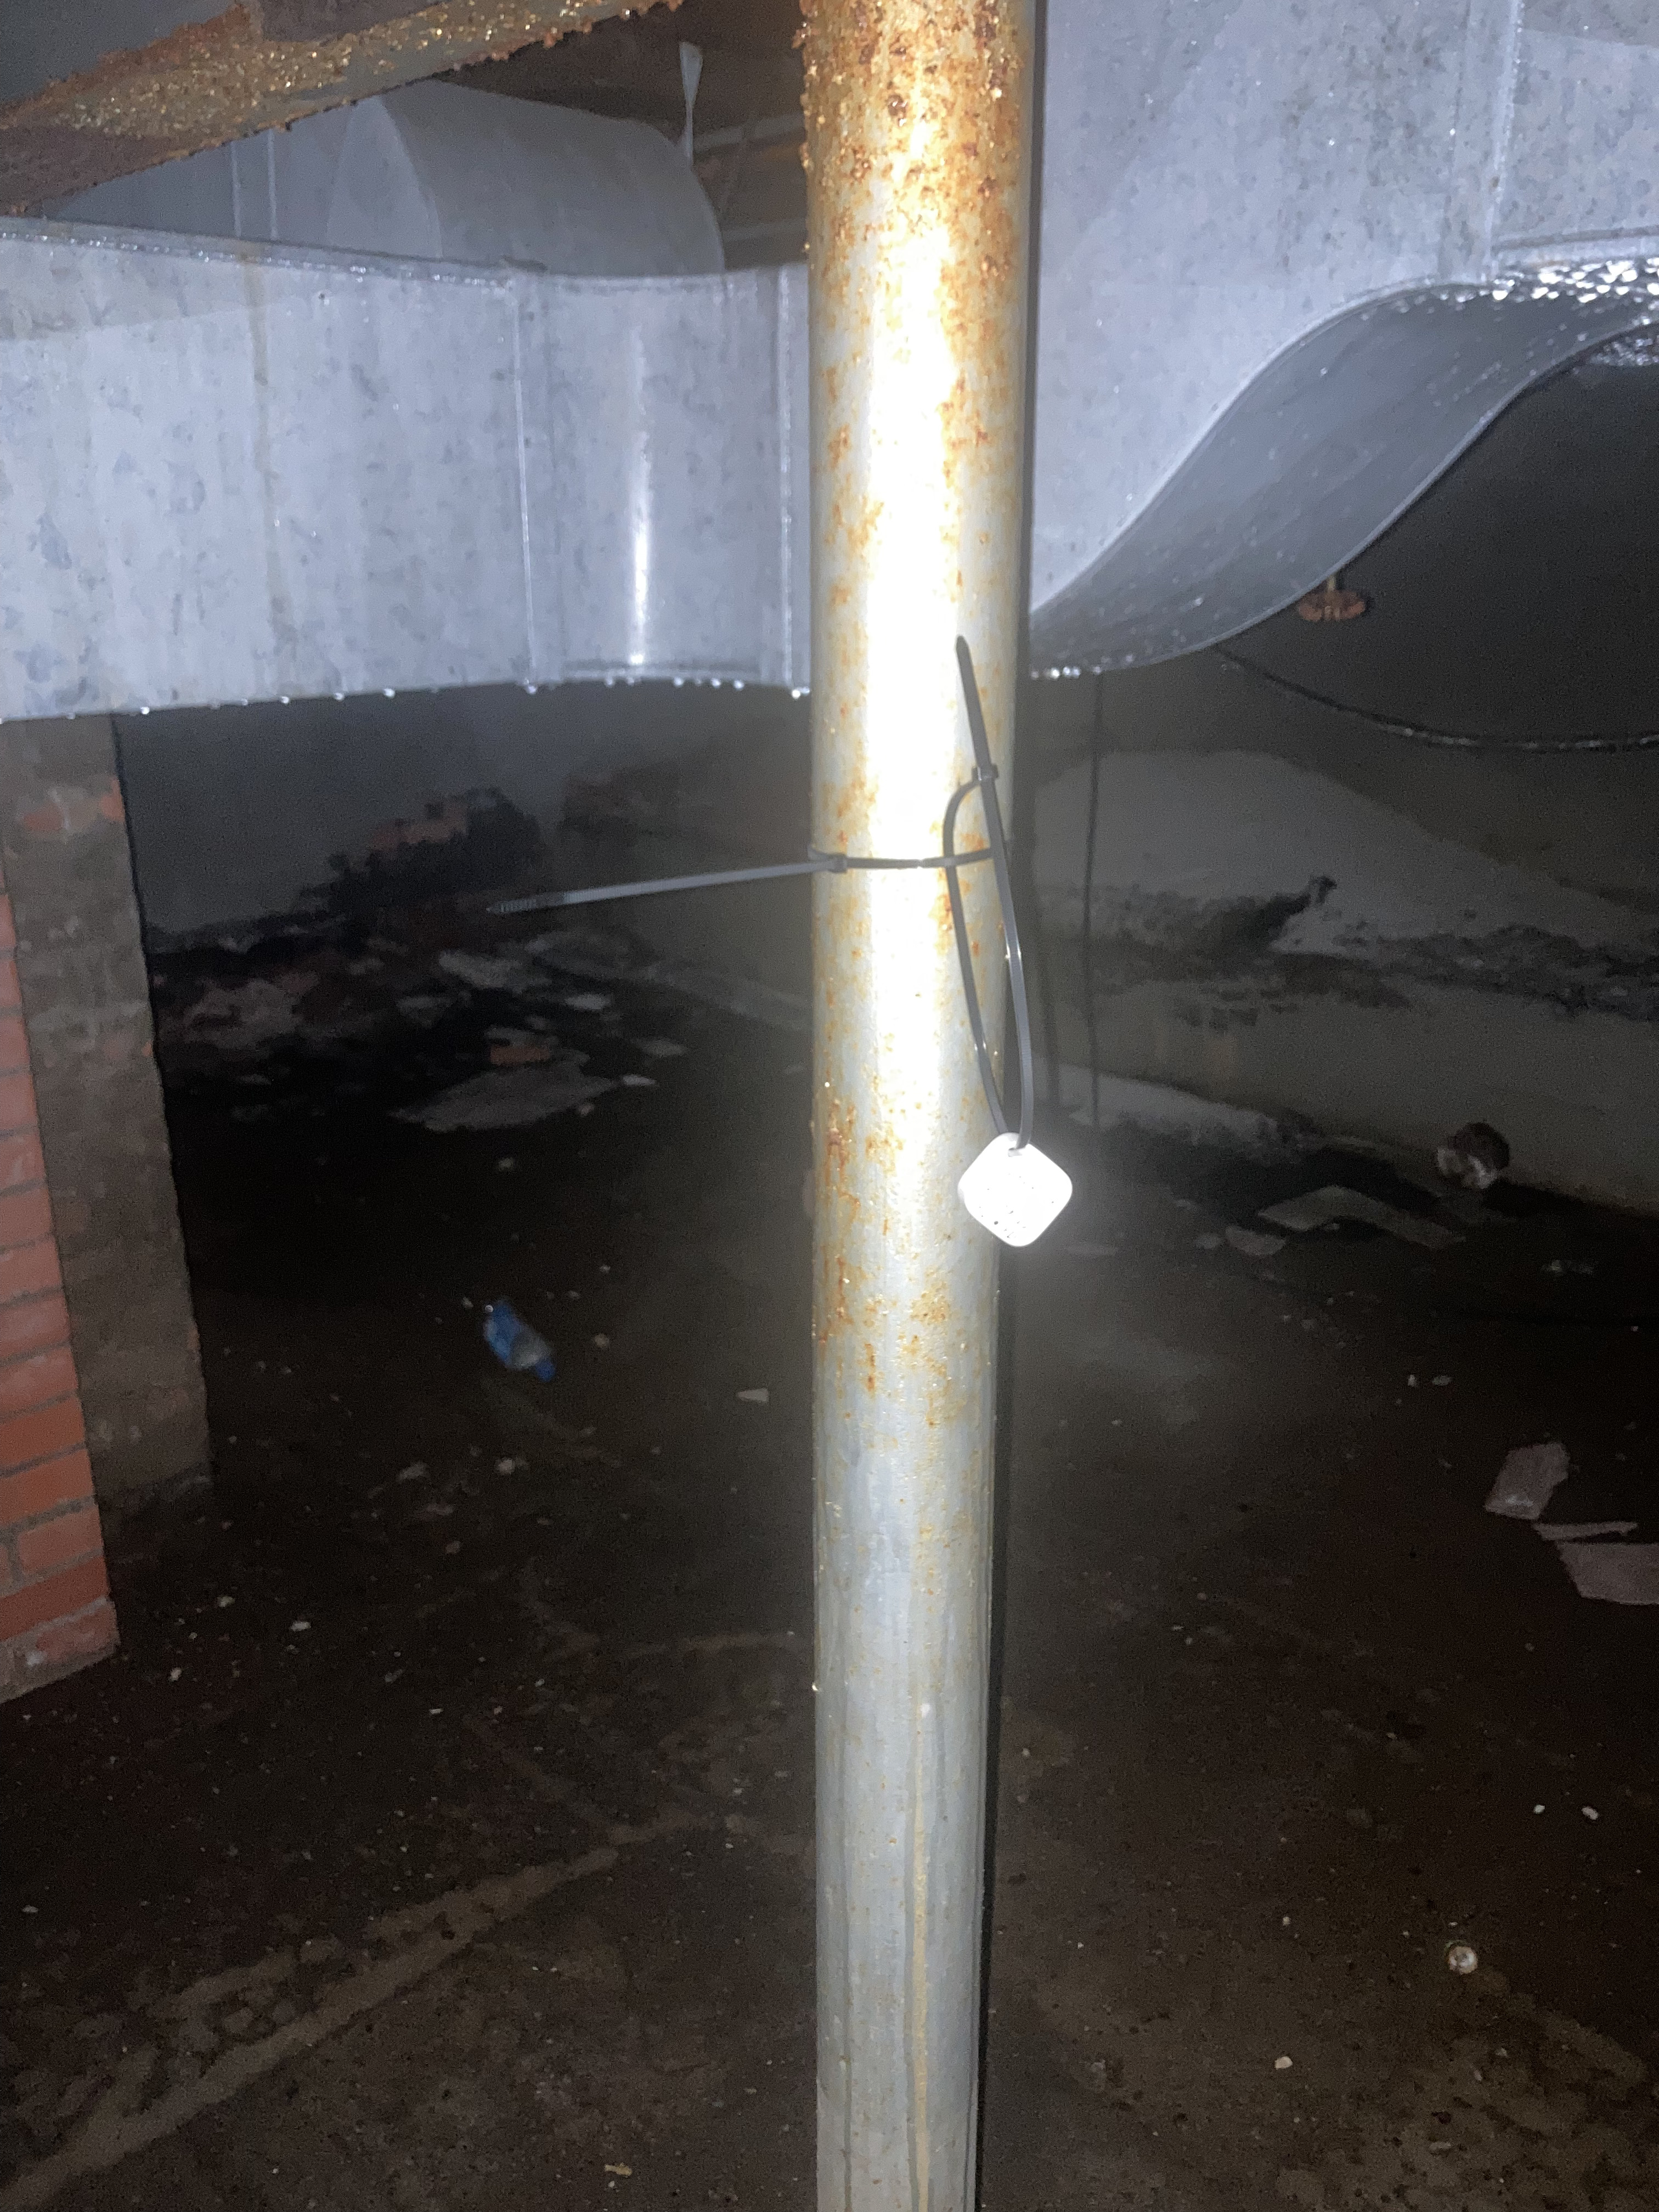
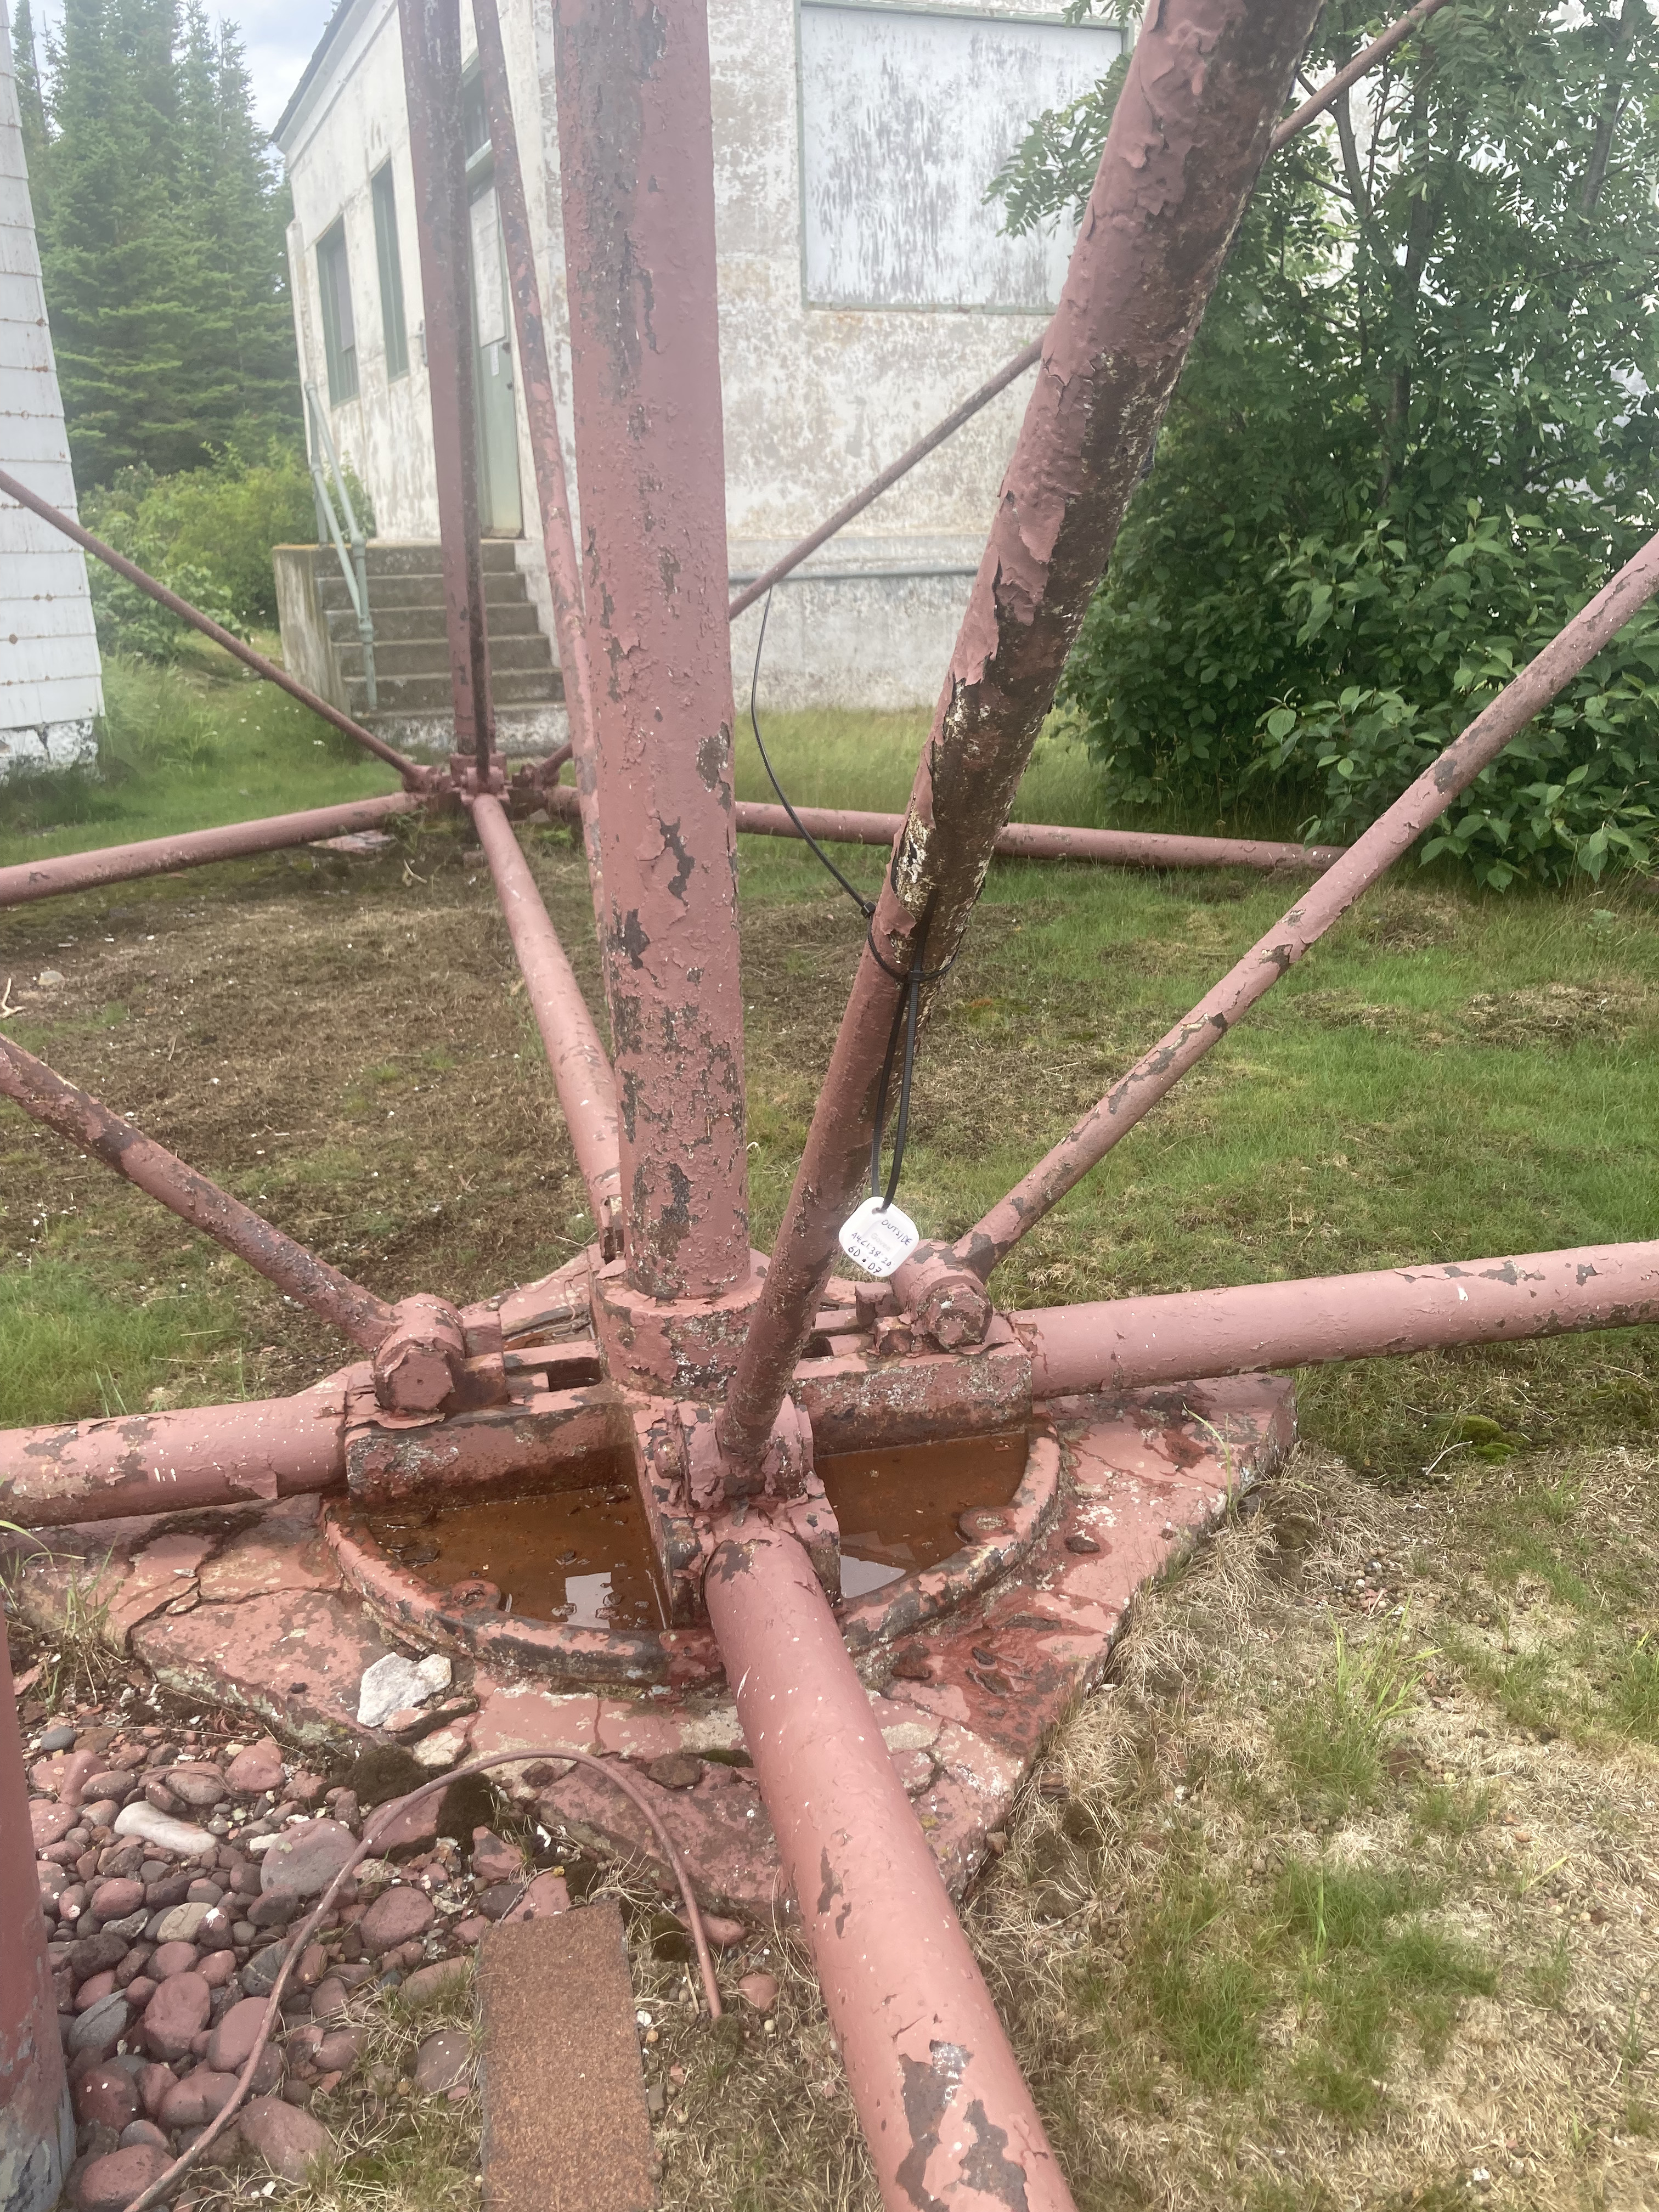
Recently, I was able to pull off the first few days of data from primitive data loggers I installed in the keeper’s dwelling on August 12. As a reminder, these are very primitive devices (Govee H5074) that only retain 2 weeks of data, and rely on connecting with a smartphone app via Bluetooth to download the data. The data retrieved so far, in raw form, looks like this:
A start-up transient is clearly visible because I turned the devices on at my house, took them to the island, and finally deployed them into the basement and outside. This whole process was done by around 3pm local time.
One interesting pattern in this data is that outdoor temperature and outdoor relative humidity correlate inversely; this makes sense, because relative humidity is relative to temperature, and the temperature increases diurnally, shrinking the relative humidity. It is more clear to consider a measurement of absolute humidity, which is independent of temperature and quantifies the moisture present in the air.
Sensors that directly measure absolute humidity are not as accessible or as easy to deploy, but the existing sensor values can be used to estimate absolute humidity with some accuracy.
An easy option down this line is to think in terms of the dew point: the temperature at which relative humidity becomes 100%. This is a bulk property of some given air, and it can be used to compare different air masses in the sense of absolute humidity, while also indicating how close that air is to condensing on a surface of a given temperature. Shown below are the indoor and outdoor dew points calculated from data so far—as well as the basement air temperature—to allow us to think a little more clearly:
This now clearly shows the problem: the dew point of the air is very near to the temperature of the air. In order to reduce condensation, we need to reduce the dew point.